Thanks for All the Fish
Well, today SOC draws to a close, so I decided to write up how things currently stand. Thanks to all the Gnomers for letting me work on this!
Abstract
The point of this project was to investigate why nautilus's startup performance was slow, and to find different ways to fix the problem.
Nautilus's startup is slow because it keeps blocking and allows other applications to run.
Sometimes it is lucky and completes its startup quickly. Other times it isn't, and gnome-panel (and all of the plugins) or other startup applications get in the way.
Problem definition
Tools
The general problem
When I started this project, I had very little idea about the overall architecture of gnome. When do various components start up? Which pieces were responsible for which parts of the system? There is documentation for some of the individual components (Nautilus's documentation is pretty good), but nothing that describes the overall startup of the gnome desktop. There are quite a few articles describing the exact startup sequences of Linux from the boot loader to the init scripts. It would be helpful if there was something similar for gnome, so it was at least clear how things were intended to work.
The problem of understanding and analyzing the complex startup of gnome is actually a more general problem. Gnome starts multiple threads, and multiple processes, each with interlocking dependencies. A few general tools have been developed for Linux which help to understand these startup sequences. No single tool seems to have all of the features needed to truly understand what is happening, so I tried a bunch of different tools.
1) Bootchart (http://www.bootchart.org/)
The first tool that I used to determine how exactly things were starting up was the "bootchart" tool. This tool was originally designed to track the startup of programs in the Linux boot process. Fortunately it is also flexible enough to monitor and track any other set of processes that are started at a later date. It gives a nice graphical chart of when various processes started, and how much each used the cpu during the specified time period.
The initial bootchart images were the first indication that something was unusual about nautilus startup. Different charts of the same gnome startup sequence provided a radically different view when things started up, and how longs things took to start. Sometimes the panel would begin first, and sometimes the gnome-settings-daemon would. This was my first clue that some sort of race was happening. If there wasn't a race, each startup should have an identical series of steps, with little to no variability.
2) strace + 'access' hacks and Federico's visualization tool.
Next I started to use the analysis tools and techniques that others had used before me. In particular, I used strace to generate, and Federico's tool to analyze the result. This provided the most complete data. I've detailed in an earlier blog entry how to get it all started up.
Once thing I haven't mentioned yet, is that I wrote a small python script to sort through the strace results. This will replace "pids" with the actual name of the processes. This makes reading the strace results much easier. (It will trace clones, forks and execs, so you can see exactly what is running when...)
#!/usr/bin/python
import fileinput
import string
pid_to_name={}
thread=1
for line in fileinput.input():
__pid = line.split()[0]
__if pid_to_name.has_key(pid):
____start =line.find(" ")
____print pid_to_name[pid] + " " +line[start:-1]
__ else:
____print line[:-1]
__if "execve(" in line:
____param = line.split()[2]
____pid_to_name[pid] = param.split("\"")[1]
__if "clone(" in line:
____new_name = pid_to_name[pid] + (".%d"%thread)
____thread = thread + 1
____new_pid = line.split("=")[-1].strip()
____pid_to_name[new_pid] = new_name
__ if "<... clone resumed>" in line:
____new_name = pid_to_name[pid] + (".%d"%thread)
____thread = thread + 1
____new_pid = line.split("=")[-1].strip()
____pid_to_name[new_pid] = new_name
3) NPTL Trace Tool (http://nptltracetool.sourceforge.net/usm_example.php)
Next, I wanted to try to visualized how the different thread interacted with the hope that I would be able to see some clear patterns as to why nautilus was continually yielding the CPU.
The NPTL trace tool looked like promising avenue, because it had a graphical interface (using ntt_paje), and it was able to analyze a the complex interaction of threaded applications. It can provide a visualization, as well as statistics about the amount of locks held, and report on the various pthread calls that were made.
The trace tool produced the results into a format the Paje visualization tool could open and analyze. Paje itself is a little clunky and requires that the GNUstep environment is installed. I was able to capture a trace of a generic application, but unfortunately when I tried to run the trace tool an nautilus, it seg faulted.
4) frysk (http://sourceware.org/frysk/)
This was another tool that promised to make visualization and debugging of complicated threading applications/environments easy to do. It, unfortunately, is still immature. When I tried to monitor system calls that nautilus made, it also crashed. However, this project is one to watch. It provides a graphical interface analyze how, and allows you to add arbitrary rules to analyze how a process and set of threads were executing.
5) Ideal tool
The ideal tool would be one that shows both when applications are running, and why they vacate the CPU when they are finished. Strace is really a poor man's version of this tool. However, it doesn't have any way to indicate when the scheduler decided to swap the running process, so if an application spends all of its time in user space, the strace method will never detect that the running application has changed.
6) Dishonorable mention
Two tools that I tried to use, but were unsuccessful were AMD's code analyst and Intel's VTune.
AMD get props for releasing their Code Analyist as GPL. It provides a GUI interface to oprofile, and some other niceties. Unfortunately, the number of distributions that it supports is rather small, and it wouldn't build on my Fedora 5 box. Even worse (in my opinion) was Intel's vtune. They provided a binary which could be used on Linux for non-commercial profiling. However, once it detected that my processor was an AMD chip, it wouldn't let me use it.
Experiments: Summary
Since it may have been difficult to follow what happened over the course of the summer, I'm going to summarize my experiments, and show how I came to the conclusions that I did.
Setup
First, my goal was to work with "warm-booting" nautilus, after everything had been loaded into the disk cache. Second, I automated the startup and collection, so that I could run the same test repeatedly, and then analyze the results by either looking at visualizations, or running the tests through gnumeric.
Goals
My goals were to remove the variability in the nautilus startup, and minimize the overall nautilus startup time.
Test 1 Full startup
I added tracing information which started at the first line of "main" in nautilus, and stopped when the icons were painted on the screen. (in icon_container expose_event).
Result:
The startup times were highly variable, and other processes (such as those launched by gnome-panel) would run in between the startup of nautilus and the drawing of the icons.
Test 2 Full startup w/a high gnome-session priority
I edited the ".gnome/gnome-session" file, and set the priority of nautilus to 10, which was higher than that of gnome-panel.
Result:
No change. Nautilus was STILL interrupted by gnome-panel processes.
Test 3 Launch simply (no wm, no gnome-panel)
Next, I removed the "wm" and "gnome-panel" from the session file, and retimed nautilus's startup.
Result:
The nautilus startup times were still highly variable. Nautilus was being interrupted by the gnome-volume-manager, and the various daemons that were launched internally by gnome-session. (gnome-keyring)
One interesting part of this investigation was that sometimes "gnome_vfs_get_volume_monitor()" took and long time to start, and other times it was very quick. Federico had seen this, and he explained what was happening. Various gnome-daemons/services are launched on demand, and this call was causing this to take place.
Test 3 Launch simply (no wm, no gnome-panel) w/a gnome-vfs preloader
I wanted to see if nautilus startup times would because a little, if the gnome-vfs-daemon was prestarted before nautilus started to launch. I modified the disk mount applet to call the gnome-volume-manager, and
exit. Then, I modified the gnome-session-manager to call this "gnome-vfs" preloader, and wait for 2 seconds while it started. The 2 second delay is an unacceptable "real" solution, but it was enough to see prestarting the daemon would increase startup time.
Result:
The variability totally disappeared, and the startup times dropped to about 1/2 second.
Test 4 Launch complete session w/preloader.
I decided to go for broke. I had the preloader within gnome-session, so I decided to try with gnome-panel and the gnome-wm turned back on.
Result:
unfortunately, the variability was back. Upon closer investigation the applications were still interrupting nautilus between the time it was initially launched and the first icons were painted on the screen.
Nautilus was yielding the cpu, and other applications (gnome-panel) were running before the nautilus startup could complete.
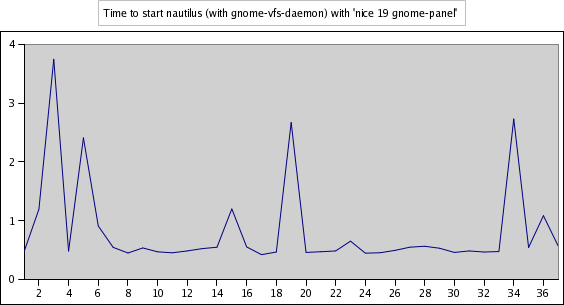
Test 5 Launch complete session w/preloader & niced gnome-panel.
Now, I wanted to see what happened if I made the nautilus the highest priority process, and basically made sure that it was the highest priority. However, since I was not able to easily boost its priority (without becomes root), I decided to drop the priority of the processes competing for the CPU. I ran the gnome-panel with a nice of 19.
Result:
Nautilus's startup was very snappy, but the gnome-panel never seemed to be painted. The variability was there because other applications (gnome-keyring) could still occasionally interrupt the startup.
Next Steps
To really solve the startup problem, nautilus probably has to be rearchitected to stop blocking or it must somehow be made a higher priority than the other applications that startup.
Here are some ideas on how to fix things:
0) Incorporate gnome-vfs startup in gnome-session
This should probably be done even if it doesn't completely solve the nautilus startup problem. gnome-vfs is needed by the gnome desktop. Launching it "on-demand" only causes blocking and unnecessary
contention. (I haven't tried this yet. )
1) Rearchitecture Nautilus to remove all of the yielding.
This is a bigger change than I could do. Even minimizing the number of times that it yields would reduce the chance that it would be interrupted.
2) Remove the on-demand loading (or at least short circuit it, so it is never used in a properly running desktop. )
IMHO, the on-demand loading is a bad idea. Ideally all of the dependencies for an application would be running before it starts. It would reduce the amount of times that applications block, and could
possibly reduce thrashing as multiple applications wait for a component to start.
3) Modify nautilus to give gnome-session a thumbs up ONLY after the icons have painted.
Right now, gnome-session and the applications that it launch have a handshake that wait for an application to start. This response handshake would have to be modified to only respond after the icons have been painted.
I've been working on getting this to work, but I can't figured out where the handshake takes place.
4) Boost nautilus's priority
If we can boost nautilus's priority, it may (possibly) not be interrupted. I couldn't figure out how to do this without root privileges.
Summary
In any event, this has been a lot of fun. I learned more about nautilus & gnome that I thought possible.
Thanks to all!
Abstract
The point of this project was to investigate why nautilus's startup performance was slow, and to find different ways to fix the problem.
Nautilus's startup is slow because it keeps blocking and allows other applications to run.
Sometimes it is lucky and completes its startup quickly. Other times it isn't, and gnome-panel (and all of the plugins) or other startup applications get in the way.
Problem definition
- minimize the amount of time between nautilus startup and mapping of the icons.
- Remove the variability in the gnome startup times.
Tools
The general problem
When I started this project, I had very little idea about the overall architecture of gnome. When do various components start up? Which pieces were responsible for which parts of the system? There is documentation for some of the individual components (Nautilus's documentation is pretty good), but nothing that describes the overall startup of the gnome desktop. There are quite a few articles describing the exact startup sequences of Linux from the boot loader to the init scripts. It would be helpful if there was something similar for gnome, so it was at least clear how things were intended to work.
The problem of understanding and analyzing the complex startup of gnome is actually a more general problem. Gnome starts multiple threads, and multiple processes, each with interlocking dependencies. A few general tools have been developed for Linux which help to understand these startup sequences. No single tool seems to have all of the features needed to truly understand what is happening, so I tried a bunch of different tools.
1) Bootchart (http://www.bootchart.org/)
The first tool that I used to determine how exactly things were starting up was the "bootchart" tool. This tool was originally designed to track the startup of programs in the Linux boot process. Fortunately it is also flexible enough to monitor and track any other set of processes that are started at a later date. It gives a nice graphical chart of when various processes started, and how much each used the cpu during the specified time period.
The initial bootchart images were the first indication that something was unusual about nautilus startup. Different charts of the same gnome startup sequence provided a radically different view when things started up, and how longs things took to start. Sometimes the panel would begin first, and sometimes the gnome-settings-daemon would. This was my first clue that some sort of race was happening. If there wasn't a race, each startup should have an identical series of steps, with little to no variability.
2) strace + 'access' hacks and Federico's visualization tool.
Next I started to use the analysis tools and techniques that others had used before me. In particular, I used strace to generate, and Federico's tool to analyze the result. This provided the most complete data. I've detailed in an earlier blog entry how to get it all started up.
Once thing I haven't mentioned yet, is that I wrote a small python script to sort through the strace results. This will replace "pids" with the actual name of the processes. This makes reading the strace results much easier. (It will trace clones, forks and execs, so you can see exactly what is running when...)
#!/usr/bin/python
import fileinput
import string
pid_to_name={}
thread=1
for line in fileinput.input():
__pid = line.split()[0]
__if pid_to_name.has_key(pid):
____start =line.find(" ")
____print pid_to_name[pid] + " " +line[start:-1]
__ else:
____print line[:-1]
__if "execve(" in line:
____param = line.split()[2]
____pid_to_name[pid] = param.split("\"")[1]
__if "clone(" in line:
____new_name = pid_to_name[pid] + (".%d"%thread)
____thread = thread + 1
____new_pid = line.split("=")[-1].strip()
____pid_to_name[new_pid] = new_name
__ if "<... clone resumed>" in line:
____new_name = pid_to_name[pid] + (".%d"%thread)
____thread = thread + 1
____new_pid = line.split("=")[-1].strip()
____pid_to_name[new_pid] = new_name
3) NPTL Trace Tool (http://nptltracetool.sourceforge.net/usm_example.php)
Next, I wanted to try to visualized how the different thread interacted with the hope that I would be able to see some clear patterns as to why nautilus was continually yielding the CPU.
The NPTL trace tool looked like promising avenue, because it had a graphical interface (using ntt_paje), and it was able to analyze a the complex interaction of threaded applications. It can provide a visualization, as well as statistics about the amount of locks held, and report on the various pthread calls that were made.
The trace tool produced the results into a format the Paje visualization tool could open and analyze. Paje itself is a little clunky and requires that the GNUstep environment is installed. I was able to capture a trace of a generic application, but unfortunately when I tried to run the trace tool an nautilus, it seg faulted.
4) frysk (http://sourceware.org/frysk/)
This was another tool that promised to make visualization and debugging of complicated threading applications/environments easy to do. It, unfortunately, is still immature. When I tried to monitor system calls that nautilus made, it also crashed. However, this project is one to watch. It provides a graphical interface analyze how, and allows you to add arbitrary rules to analyze how a process and set of threads were executing.
5) Ideal tool
The ideal tool would be one that shows both when applications are running, and why they vacate the CPU when they are finished. Strace is really a poor man's version of this tool. However, it doesn't have any way to indicate when the scheduler decided to swap the running process, so if an application spends all of its time in user space, the strace method will never detect that the running application has changed.
6) Dishonorable mention
Two tools that I tried to use, but were unsuccessful were AMD's code analyst and Intel's VTune.
AMD get props for releasing their Code Analyist as GPL. It provides a GUI interface to oprofile, and some other niceties. Unfortunately, the number of distributions that it supports is rather small, and it wouldn't build on my Fedora 5 box. Even worse (in my opinion) was Intel's vtune. They provided a binary which could be used on Linux for non-commercial profiling. However, once it detected that my processor was an AMD chip, it wouldn't let me use it.
Experiments: Summary
Since it may have been difficult to follow what happened over the course of the summer, I'm going to summarize my experiments, and show how I came to the conclusions that I did.
Setup
First, my goal was to work with "warm-booting" nautilus, after everything had been loaded into the disk cache. Second, I automated the startup and collection, so that I could run the same test repeatedly, and then analyze the results by either looking at visualizations, or running the tests through gnumeric.
Goals
My goals were to remove the variability in the nautilus startup, and minimize the overall nautilus startup time.
Test 1 Full startup
I added tracing information which started at the first line of "main" in nautilus, and stopped when the icons were painted on the screen. (in icon_container expose_event).
Result:
The startup times were highly variable, and other processes (such as those launched by gnome-panel) would run in between the startup of nautilus and the drawing of the icons.
Test 2 Full startup w/a high gnome-session priority
I edited the ".gnome/gnome-session" file, and set the priority of nautilus to 10, which was higher than that of gnome-panel.
Result:
No change. Nautilus was STILL interrupted by gnome-panel processes.
Test 3 Launch simply (no wm, no gnome-panel)
Next, I removed the "wm" and "gnome-panel" from the session file, and retimed nautilus's startup.
Result:
The nautilus startup times were still highly variable. Nautilus was being interrupted by the gnome-volume-manager, and the various daemons that were launched internally by gnome-session. (gnome-keyring)
One interesting part of this investigation was that sometimes "gnome_vfs_get_volume_monitor()" took and long time to start, and other times it was very quick. Federico had seen this, and he explained what was happening. Various gnome-daemons/services are launched on demand, and this call was causing this to take place.
Test 3 Launch simply (no wm, no gnome-panel) w/a gnome-vfs preloader
I wanted to see if nautilus startup times would because a little, if the gnome-vfs-daemon was prestarted before nautilus started to launch. I modified the disk mount applet to call the gnome-volume-manager, and
exit. Then, I modified the gnome-session-manager to call this "gnome-vfs" preloader, and wait for 2 seconds while it started. The 2 second delay is an unacceptable "real" solution, but it was enough to see prestarting the daemon would increase startup time.
Result:
The variability totally disappeared, and the startup times dropped to about 1/2 second.
Test 4 Launch complete session w/preloader.
I decided to go for broke. I had the preloader within gnome-session, so I decided to try with gnome-panel and the gnome-wm turned back on.
Result:
unfortunately, the variability was back. Upon closer investigation the applications were still interrupting nautilus between the time it was initially launched and the first icons were painted on the screen.
Nautilus was yielding the cpu, and other applications (gnome-panel) were running before the nautilus startup could complete.
Test 5 Launch complete session w/preloader & niced gnome-panel.
Now, I wanted to see what happened if I made the nautilus the highest priority process, and basically made sure that it was the highest priority. However, since I was not able to easily boost its priority (without becomes root), I decided to drop the priority of the processes competing for the CPU. I ran the gnome-panel with a nice of 19.
Result:
Nautilus's startup was very snappy, but the gnome-panel never seemed to be painted. The variability was there because other applications (gnome-keyring) could still occasionally interrupt the startup.
Next Steps
To really solve the startup problem, nautilus probably has to be rearchitected to stop blocking or it must somehow be made a higher priority than the other applications that startup.
Here are some ideas on how to fix things:
0) Incorporate gnome-vfs startup in gnome-session
This should probably be done even if it doesn't completely solve the nautilus startup problem. gnome-vfs is needed by the gnome desktop. Launching it "on-demand" only causes blocking and unnecessary
contention. (I haven't tried this yet. )
1) Rearchitecture Nautilus to remove all of the yielding.
This is a bigger change than I could do. Even minimizing the number of times that it yields would reduce the chance that it would be interrupted.
2) Remove the on-demand loading (or at least short circuit it, so it is never used in a properly running desktop. )
IMHO, the on-demand loading is a bad idea. Ideally all of the dependencies for an application would be running before it starts. It would reduce the amount of times that applications block, and could
possibly reduce thrashing as multiple applications wait for a component to start.
3) Modify nautilus to give gnome-session a thumbs up ONLY after the icons have painted.
Right now, gnome-session and the applications that it launch have a handshake that wait for an application to start. This response handshake would have to be modified to only respond after the icons have been painted.
I've been working on getting this to work, but I can't figured out where the handshake takes place.
4) Boost nautilus's priority
If we can boost nautilus's priority, it may (possibly) not be interrupted. I couldn't figure out how to do this without root privileges.
Summary
In any event, this has been a lot of fun. I learned more about nautilus & gnome that I thought possible.
Thanks to all!
posted by ezolt at
6:16 PM
|
110 comments
![]()