Sparklines and other goodies
Visualization of Perf data
I'm spending a little bit of time setting up my tools to get starting with the profiling. I want to be able to combine the information that Federico's patches provides with the CPU usage information provided by bootchart. Once I have this working, I will be able to run a test, and see all of the perf data in a single picture.
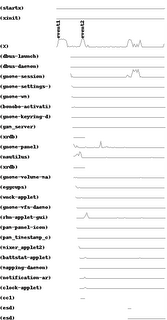
I'm using Tufte's ideas of sparklines (http://en.wikipedia.org/wiki/Sparkline) to convey how the CPU usage changes over time. I'm adapting a python script that can be used to generate sparklines (http://bitworking.org/projects/sparklines/ ).
Right now, it will read the data files generated by the bootchartd daemon, so you can pick your visualization (native bootchart -or- sparkline) after the data has been generated.
I added the ability to automatically add tags on different events, so that I can integrate the profiling events generated by Federico's patches into the graph.
Here's a current sample: (I know, it needs a legend.. Right now the graph is of the process's CPU usage (combined user+system))

(OH, BTW: This patch (http://bugzilla.gnome.org/show_bug.cgi?id=319682) to add sparklines should DEFINITELY be included in gnome-system-monitor)
Gathering Profiling Data
I've been thinking a bit about how Federico added the current profiling information, and I think it is the right way to go. I don't need the capabilities of DBUS right now, because I can do all of the analysis after the run has completed.
I think that Federico's profiling changes could be included in the mainline of gnome if we wrapped them in a test of an environmental variable (say GNOME_PROFILING). A getenv is trivial compared to the other stuff that goes on in the libraries/apps, and it would allow us to profile stuff in the field as well.
Once I finish up the visualization stuff, I will add the that to his profiling patches. I am probably also going to add a printout of the "pid" (rather than program name), so that I merge the data from bootchart and the patches.
X startup time
It looks like Thomas Leonard and Daniel Stone have come up with a way to dramatically speed up X server startup.
Combining a patch in bugzilla and patch developed on the list by Thomas and Daniel, the there is almost a 2X speedup in the X server startup time.
For more info follow the thread started here:
http://lists.freedesktop.org/archives/xorg/2006-June/015746.html
I'm spending a little bit of time setting up my tools to get starting with the profiling. I want to be able to combine the information that Federico's patches provides with the CPU usage information provided by bootchart. Once I have this working, I will be able to run a test, and see all of the perf data in a single picture.
I'm using Tufte's ideas of sparklines (http://en.wikipedia.org/wiki/Sparkline) to convey how the CPU usage changes over time. I'm adapting a python script that can be used to generate sparklines (http://bitworking.org/projects/sparklines/ ).
Right now, it will read the data files generated by the bootchartd daemon, so you can pick your visualization (native bootchart -or- sparkline) after the data has been generated.
I added the ability to automatically add tags on different events, so that I can integrate the profiling events generated by Federico's patches into the graph.
Here's a current sample: (I know, it needs a legend.. Right now the graph is of the process's CPU usage (combined user+system))

(OH, BTW: This patch (http://bugzilla.gnome.org/show_bug.cgi?id=319682) to add sparklines should DEFINITELY be included in gnome-system-monitor)
Gathering Profiling Data
I've been thinking a bit about how Federico added the current profiling information, and I think it is the right way to go. I don't need the capabilities of DBUS right now, because I can do all of the analysis after the run has completed.
I think that Federico's profiling changes could be included in the mainline of gnome if we wrapped them in a test of an environmental variable (say GNOME_PROFILING). A getenv is trivial compared to the other stuff that goes on in the libraries/apps, and it would allow us to profile stuff in the field as well.
Once I finish up the visualization stuff, I will add the that to his profiling patches. I am probably also going to add a printout of the "pid" (rather than program name), so that I merge the data from bootchart and the patches.
X startup time
It looks like Thomas Leonard and Daniel Stone have come up with a way to dramatically speed up X server startup.
Combining a patch in bugzilla and patch developed on the list by Thomas and Daniel, the there is almost a 2X speedup in the X server startup time.
For more info follow the thread started here:
http://lists.freedesktop.org/archives/xorg/2006-June/015746.html

2 Comments:
Regarding X startup time, it seems that actually the saving
with both patches combined is only about 5%...
By Anonymous, at 1:49 AM
Yeah. That came as a later development. Bummer. I guess anything is better, though.
By ezolt, at 10:38 AM
Post a Comment
<< Home